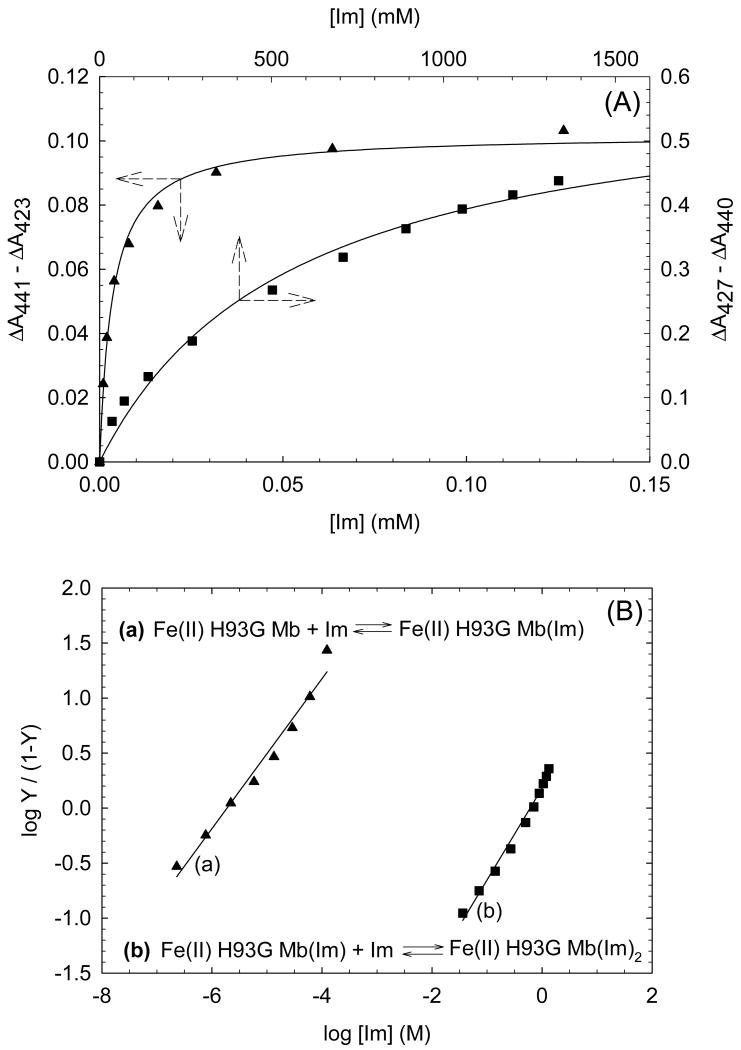
Fig. 9.
(A) Hyperbolic saturation plots of the imidazole (Im) titration results shown in Fig. 5(A) (ligand-free) and Fig. 6(A) (mono-Im-bound) for Im binding to exogenous ligand-free (closed triangle) and mono-Im-bound (closed square) ferrous H93G Mb. Maximum absorbance changes in difference spectra in the Soret region (not shown) are plotted as a function of total ligand concentration. Lines drawn are non-linear fits for a bimolecular association model to the data. (B) Hill plot of the titration data shown in (A). In the Y -axis label, Y is fractional saturation of H93G Mb with Im. The Hill plots yield Kd1 = 2 μM (closed triangles) and Kd2 = 0.61 M (closed squares) with slopes of 0.68 and 0.83, respectively. For additional information, see reference [25]. Reproduced from reference [25] with permission of the copyright holders.

