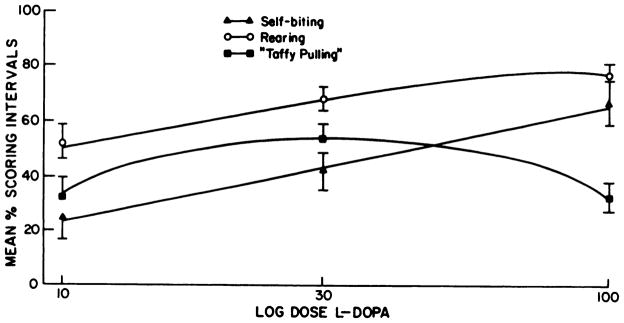
Fig. 3.
Dose-response effects of L-dopa on selected behaviors in neonatal 6-OHDA-treated rats. Behaviors were assessed as described under “Methods” at 10,30 and 100 mg/kg of L-dopa. Animals are the same as those used to make the dose-response curve for SMB in neonatal 6-OHDA-treated rats (fig. 1). Log dose L-dopa refers to doses of L-dopa on a logarithmic plot.

