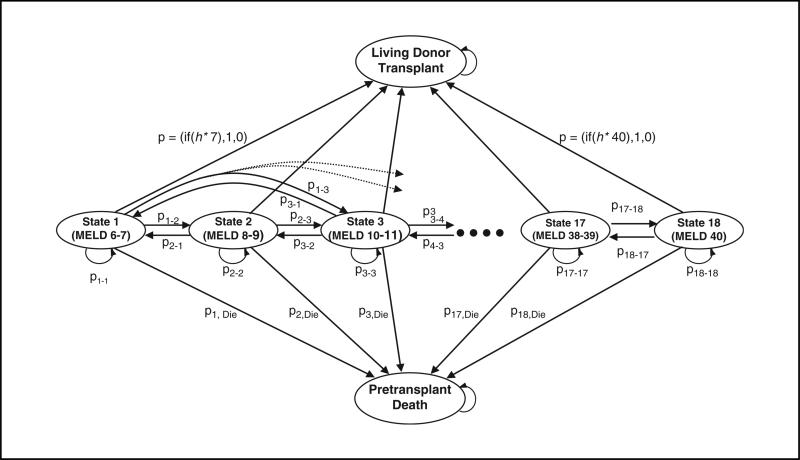
Figure 1.
State transition diagram for a Markov model. The circles labeled state 1 (Model for End-stage Liver Disease [MELD] 6–7) through state 18 (MELD 40) represent possible health states for the patient (i.e., the patient can be at one of the 18 states at any time period). Note that each state actually represents 2 adjacent MELD scores; for instance, 1 represents MELD scores 6 and 7, 2 represents MELD scores 8 and 9, and so on. Each time period, the patient may transit to one of the other MELD states or die. At each state, there is a Boolean node that will direct the patient to accept the living donor organ if the MELD score is greater than some value (h*): the optimal transplant MELD is found by solving the model over all possible values of h*. Note that the transition probabilities between pretrans-plant states in the figure depend on the policy; however, this dependency is suppressed for the clarity of presentation. As a result, the transition probabilities between pretransplant states in the figure represent only the transition probabilities when h* = 41.

