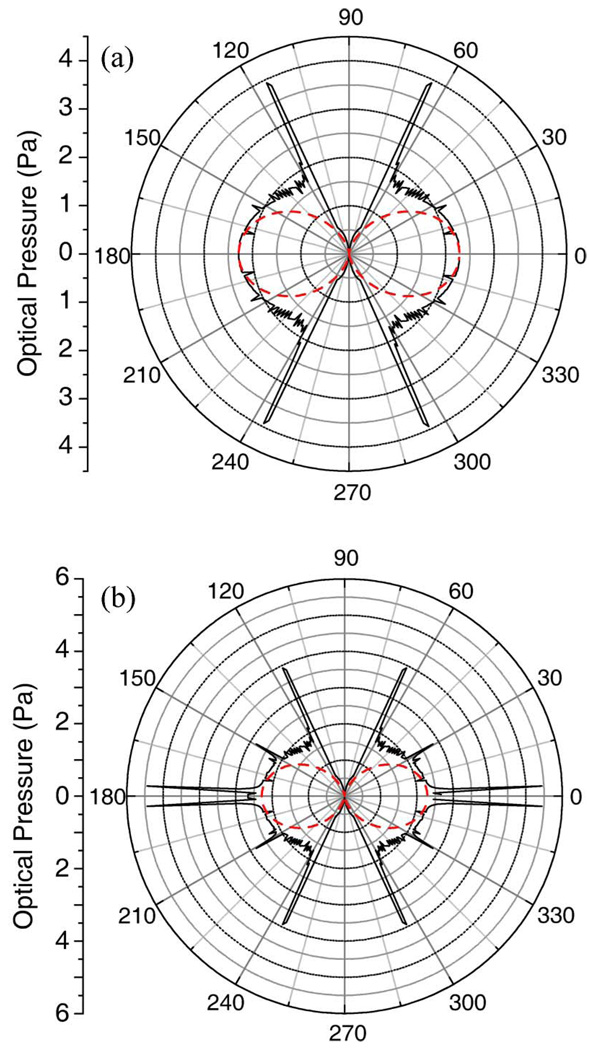
Fig. 1.
(Color online) Calculated stress distributions on a 10 µm diameter sphere trapped in an optical stretcher with a fiber separation of 200 µm. The cosine-squared approximation (dotted line) is compared to the RO model (solid line) (a) ignoring or (b) allowing for multiple internal reflections.

