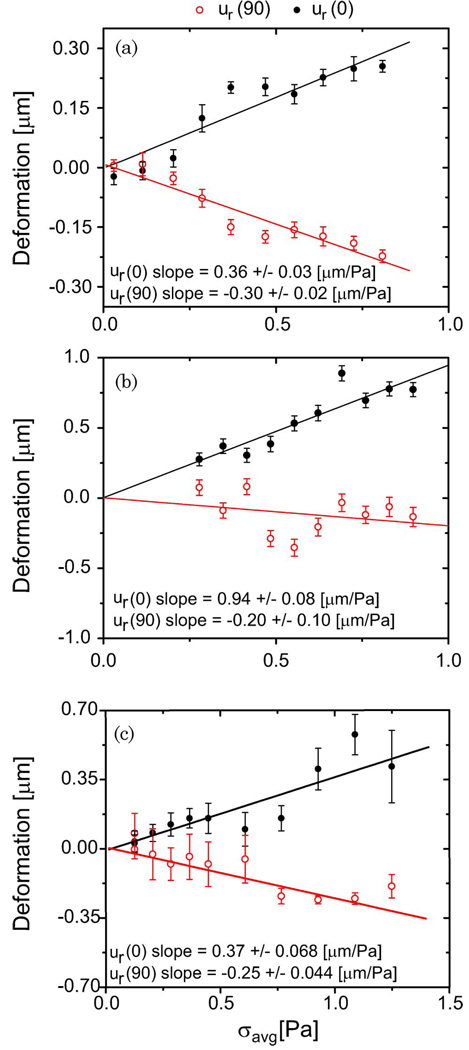
Fig. 7.
(Color online) Sample (a) RBC, (b) MLO-Y4, and (c) 2T3 major-axis (closed symbols) and minor-axis (open symbols) deformations measured in response to optical stretching. The data-points and errorbars report the average and standard deviation of at least 15 single-cell measurements made at each laser power. The stress was calculated from the RO model simulation of the experiment. The cell stiffness is inversely proportional to the slopes of the best-fit lines.

