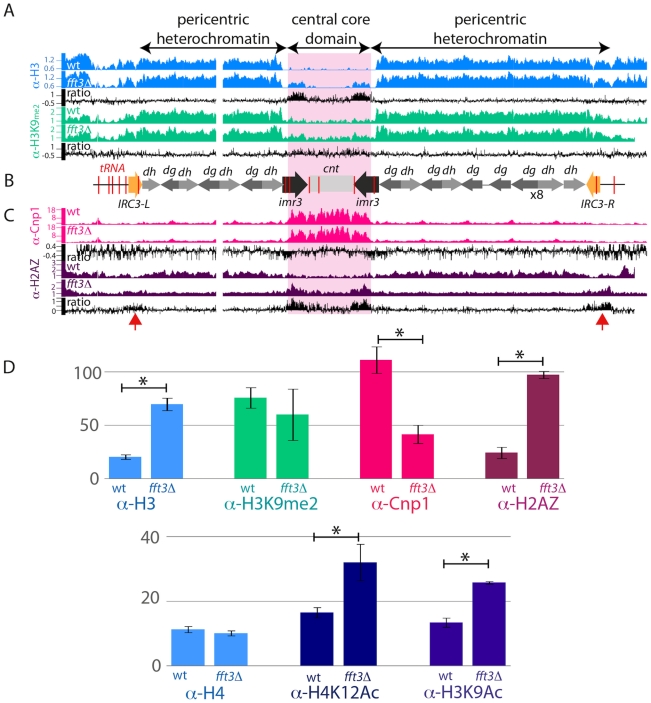
Figure 3. Centromeric boundary function is impaired in fft3Δ cells.
A) The ChIP-chip distributions of histone H3 (blue) and H3K9me2 (green) at centromere 3 in wt and fft3Δ cells are shown in Genome Browser images. Y-axis: Linear scale. Mutant/wt ratios are indicated in black in log2 scale. B) A schematic diagram of centromere 3. tRNA genes are marked in red and the IRC elements in yellow. C) Genome browser images showing ChIP-chip data for Cnp1 (red) and H2A.ZPht1 (purple). Y-axis: Linear scale. Mutant/wt ratios are shown in black in log2 scale. D) Bar diagrams showing the results from real-time quantitative PCR analysis of ChIP signals. The enrichments at imr3 are relative to the act1+ euchromatic control locus except for the Cnp1 enrichment which is relative to cen1. The ChIP signals were normalized to input samples from the same chromatin extract. The error bars represent S.D. values from triplicate samples. *indicates a significant difference between wt and mutant (P<0.01; T-test, two-tailed, unpaired).

