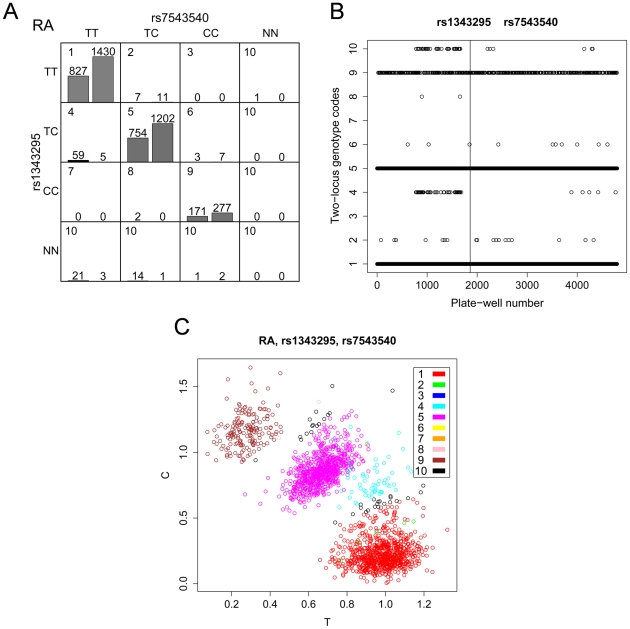
Figure 3. Batch effect observed for SNPs rs1343295 and rs7543540.
(A) For each two-locus genotype combination, a genotype code is shown in the upper left corner of each cell. NN denotes missing genotypes. The distribution of RA cases (left bar) and controls (right bar) in each genotype combination is shown with the number of observations indicated above the bars. The samples are mainly distributed on the diagonal of the genotype combinations, where two SNPs are in LD. Note that many genotype combinations are sparse. An excessive number of cases relative to controls was observed for the genotype combination TC for rs1343295 and TT for rs7543540 (code 4), which primarily caused the association. (B) Genotype combination codes (1–10) of samples were plotted against the plate and well numbers of samples in 96-well plates. Codes 1–9 denote the nine non-missing genotypes shown in (A). Samples with missing genotypes were grouped in code 10. The vertical line separates cases (left) and controls (right). The 59 cases of one particular genotype combination (code 4) were not evenly distributed among the wells, but severely aggregated. (C) Cluster plot for RA cases. The coordinates denote the allele intensities of the first SNP in the title (rs1343295) and the 10 colors denote the 10 genotype combinations of the two SNPs. The genotype clustering of 59 cases (plotted in cyan circles) are ambiguous between heterozygotes and homozygotes for rs1343295, and genotypes were considered heterozygotes. In fact, the genotypes of these 59 cases should probably be considered homozygotes, and then no association would exist; however, the batch effect produced this artificial error due to the low-quality genotyping and subsequent artificial clustering.

