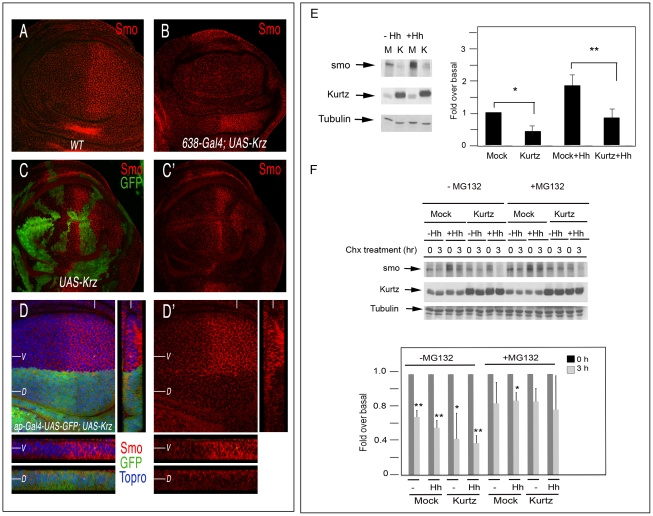
Figure 5. Effects of krz on Smo expression.
(A–D) Expression of Smo in different genetic backgrounds in which Krz is over-expressed. (A) Wild type control third instar disc showing normal Smo expression (red). (B) Elimination of Smo expression of the wing blade of 638-Gal4/+; UAS-krz2a2/+ discs. (C–C′) Expression of Smo (red) in clones of cells over-expressing Krz (labelled in green in C). C′ is the red channel of C. (D) Expression of Smo in ap-Gal4 UAS-GFP/+; UAS-krz2a3/+. Below are transversal sections in the ventral (V, above) and dorsal (D, below) compartments and to the right a longitudinal section showing Smo expression. Note in C and D the cell-autonomous elimination of Smo by excess of Krz. (E, F) Krz modulates Smo stability and degradation by the proteasome pathway. (E) Krz over-expression decreases steady-state Smo levels. Stable Myc-Smo S2 cells were transiently transfected with either empty pUAS/actinGAL4 vector or pUAS-krz/actinGAL4 vector, and incubated in presence or absence of Hh conditioned medium, as indicated in the figure. The levels of Smo were determined in the whole cellular lysates by immunoblotting. The basal amount of Smo in the mock-transfected cells was defined as 1 and all the data were normalised by Tubulin protein levels. Data are the mean±SEM of five independent experiments. A representative gel is shown. * (P<0.05); *** (P<0.001) when compared to values of mock-transfected cells. (F) Smo turnover is inhibited by the proteosome inhibitor MG132, and the stability of Myc-Smo is increased in the presence of MG132 even when Krz is over-expressed. Smo protein levels were examined by immunoblot analysis in cells incubated with control or Hh conditioned medium upon treatment with Cycloheximide (Chx) at 0 and after two hours treatment, in the absence or presence of MG132 as indicated. The amount of Smo at 0 h was defined as 1 for each case, and data normalized by Tubulin protein levels. Data are the mean±SEM of three independent experiments. A representative gel is shown. * (P<0.05); *** (P<0.001) when compared to values at 0 h.

