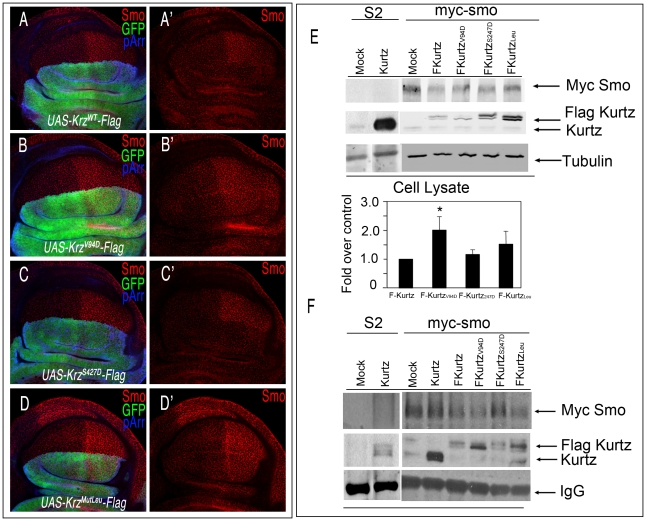
Figure 6. Interactions between Krz mutant forms and Smo.
(A–D) Effects of different Krz-Flag mutant forms expressed in the dorsal compartment on Smo expression. (A) Control ap-Gal4 UAS-GFP/+; UAS-krz-Flag/+ showing Flag (blue) and GFP (green), and the elimination of Smo (red) in the dorsal compartment. (B) ap-Gal4 UAS-GFP/+; UAS-krzV94D-Flag/+. The mutant protein KrzV94D is over-expressed (blue staining in B), but it does not affect Smo expression (red in B′). (C) ap-Gal4 UAS-GFP/+; UAS-krzS427D-Flag/+. The mutant protein KrzS427D is over-expressed (blue staining in C), and eliminates Smo expression from dorsal cells (red in C′). (D) ap-Gal4 UAS-GFP/+; UAS-krzLeu-Flag/+. The mutant protein KrzLeu is over-expressed (blue staining in D), but it does not affect Smo expression (red in D′). A′–D′ corresponds to the single red channels showing Smo expression. (E, F) Interactions between Krz and Smo in S2 cells. Stable Myc-Smo S2 or S2 control cells were transiently transfected with either empty pUAS/actinGAL4 vector (mock lanes), pUAS-krz/actinGAL4 (Kurtz lanes) or pAWF-krz mutant constructs (pAWF-krzwt, pAWF-krzV94D, pAWF-krzS247D or pAWF-krzLeu; F-Kurtz construct lanes) as indicated in the figure, in presence of Hh conditioned medium for 18–24 hrs. Cell extracts were immunoprecipitated with anti-Myc affinity gel. Immunoprecipitates (F) and whole-cell lysates (E) were immunoblotted with antibodies against Krz (detecting both endogenous Kurtz, lower band and the Flag-Kurtz protein, upper band), Myc (detecting Myc-Smo protein) and Tubulin. In control IPs carried out in Smo-Myc non-expressing cells transfected with pAWF-krzwt, pAWF-krzV94D, pAWF-krzS247D or pAWF-krzLeu, we did not detect any Krz or FLAG-Krz protein (data not shown). The levels of Smo were determined in the whole cellular lysates by immunoblotting. The basal amount of Smo in the Krzwt transfected cells was defined as 1 and all data were normalised by tubulin protein levels. Data are the mean ±SEM of three independent experiments. A representative gel is shown. * (P<0.05); *** (P<0.001) *, P<0.05; ***, when compared to values of Krzwt transfection.

