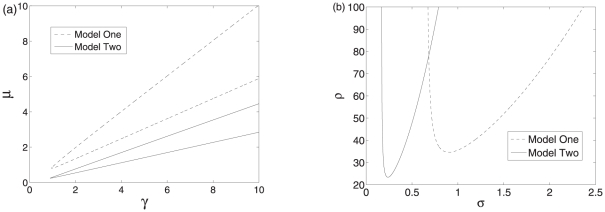
Figure 6. Bifurcation diagrams of the two systems.
(a) The bifurcation diagrams with  and
and  as control parameters. (b) The bifurcation diagrams with
  and
and  as control parameters. The regions enclosed by dashed and solid lines are the oscillatory regions of the two systems. Other parameter values are
  ,
,  ,
,  ,
,  ,
,  , and
, and  .
.

