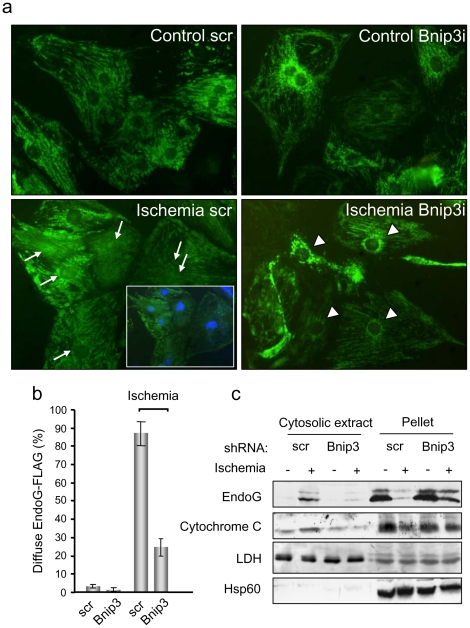
Figure 3. BNIP3 controls EndoG release from cardiac mitochondria during ischemia.
a) Immunofluorescence of EndoG-FLAG in overexpressing neonatal cardiomyocytes cultured in control (control) and ischemic (ischemia) conditions for 12 hours. Bnip3i: cardiomyocytes with silenced expression of Bnip3 by shRNA. Scr: scrambled. Arrows: cardiomyocytes where EndoG-FLAG expression includes the nucleus. A merged image including Hoechst nuclear staining is included for ischemic cardiomyocytes to localize the nuclei. Arrowheads: ischemic cardiomyocytes where EndoG-FLAG expression excludes the nucleus. Similar results were obtained in three independent experiments. b) Quantification of the experiments described in a). The graph shows the percentage of cardiomyocytes with diffuse pattern of the EndoG-FLAG staining in control and ischemic cultures of scrambled-transduced cells (scr) and cells transduced with viruses for Bnip3 silencing (Bnip3), counted in three independent experiments. Error bars are s.e.m. c) Endogenous EndoG release was assessed by Western Blot in cytosolic extracts from control cardiomyocytes (scr) and cardiomyocytes expressing low levels of Bnip3 (achieved by shRNA-driven knockdown) in standard and ischemic conditions. Lactate dehydrogenase (LDH) expression was checked as a cytosolic marker and Hsp60 expression was assessed as a mitochondrial membrane marker. The image shows representative results from 3 independent experiments.

