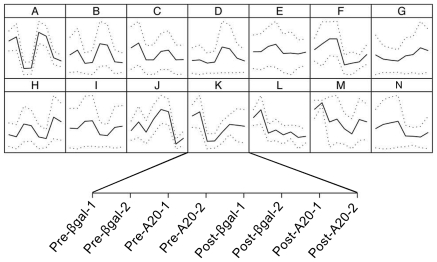
Figure 2. Transcriptional changes induced by A20 at the basal level and following liver resection.
Self-organizing map (SOM) analysis representing the different expression patterns. Genes are selected using supervised analysis on the basis of LCB of the fold change (FC) in the following groups: “βgal before resection [pre-βgal-1 and pre-βgal-2]”, “βgal after resection [post-βgal-1 and post-βgal-2]”, “A20 before resection [pre-A20-1 and pre-A20-2]” and “A20 after resection [post-A20-1 and post-A20-2]. SOM clustering is performed on the 1,595 genes obtained after analysis of the genes that were differentially expressed among the four possible groups mentioned above (Informative genes analysis section in methods). To understand the biological theme of SOM patterns, Gene Ontology (GO) analysis was performed on each pattern, and identified a number of genes that regulated various interesting biological processes.

