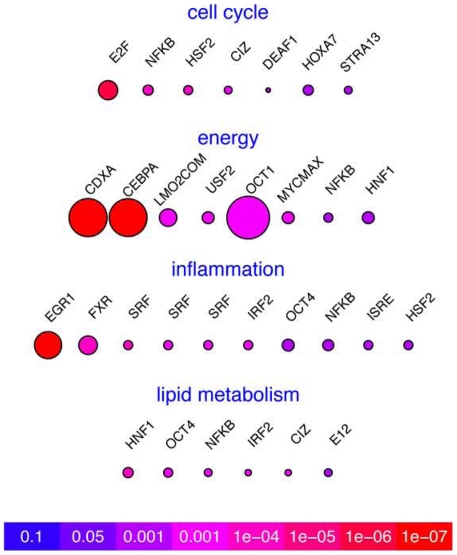
Figure 5. Regulatory analysis of over-represented transcription factor-binding sites (TFBS) based on the genes affected by A20 overexpression.
Significantly enriched TFBS were determined by promoter analysis of genes that were affected by A20 within the following networks: cell cycle, energy production, inflammation and immune system related, and lipid and carbohydrate metabolism. The number of genes impacted by a given transcription factor are reflected by the node size and statistical enrichment (P value), using a color scale (red for highest enrichment and blue for no enrichment). P values were derived from Fisher Exact test. The TFBS analysis was performed using ExPlain 3.0 (http://explain.biobase-international.com/) for detection of over-represented transcription factor binding sites. The analysis was performed on 2000 bp upstream to 100 bp downstream of the transcription start site of each gene.

