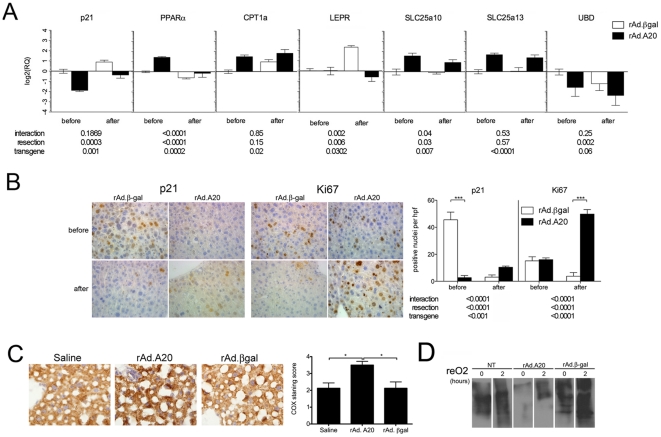
Figure 6. validation of A20 target genes in hepatocytes.
A) qRT-PCR was performed on mouse liver samples harvested before and 24 h after extended LR. Graph represents the statistical analyzes of relative mRNA levels after normalization by βactin. Results are expressed as mean ± SEM of 4–6 animals. P values were calculated by using 2-way ANOVA for resection, transgene, and the interaction. P values were listed under the graph. Differences were considered significant when P<0.05. B) Representative photomicrographs showing decreased p21waf1 positive cells in liver samples transduced with recombinant adenovirus (rAd.)A20, as compared to control rAd. βgalactosidase (βgal) before resection and increased Ki67 staining 48 hrs after LR. Graph shows quantification of positive nuclei per high power field. Each bar represents the mean±SE from 4–6 different animals. Original magnification, X400. ***p<0.001. C) Representative photomicographs showing increased COX activity in saline, rAd.A20 and rAd. βgal transduced liver tissues 24 hrs following 78% LR. Graph shows scores of COX activity staining per high power field. Each bar represents the mean±SE from 4–5 different animals. *p<0.05. D) Representative Oxyblot of rat primary hepatocytes transduced with rAd.A20 or rAd. βgal control adenovirus for 48 h and exposed to 60 minutes hypoxia (1% O2) followed by 120 minutes reoxygenation. Cell lysates were immunoblotted for the detection of carbonyl groups (n = 3).

