
Figure 5.
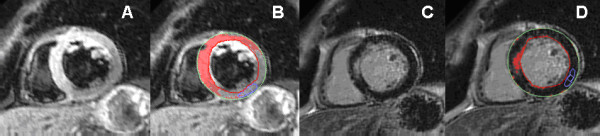
Assessment of myocardial salvage after acute, reperfused myocardial infarction. A: T2-weighted CMR showing high signal intensity of the anterior, anteroseptal and inferoseptal segments (area at risk). B: Computer-aided signal intensity analysis of the T2-weighted image normalized to normal, uninjured myocardium. Red indicates a signal intensity of >2 standard deviations above remote, uninjured myocardium. C: Contrast-enhanced image (late gadolinium enhancement) showing high signal intensity reflecting increased contrast accumulation in necrotic myocardium. D: Computer-aided signal intensity analysis of the late gadolinium enhancement image with color-coded display of relative signal intensity, normalized to remote myocardium. Red indicates a signal intensity of >5 standard deviations above remote, uninjured myocardium. The comparison of edema (panels A, B) with necrosis (panels C, D) shows myocardial edema in areas without necrosis, indicating major myocardial salvage.