
Figure 4.
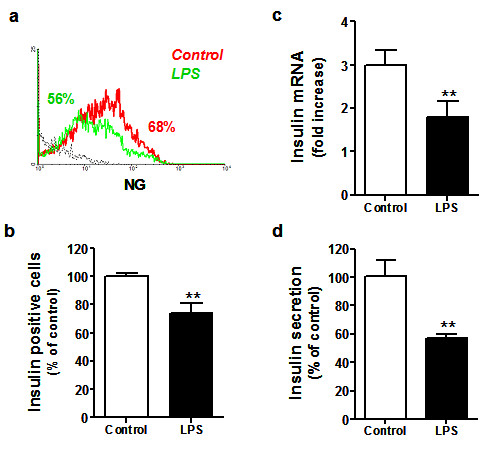
Effects of LPS treatment on insulin synthesis and secretion by β-cells. After 48 h of LPS stimulation, the effects on insulin homeostasis were measured by flow cytometry. (a) Representative histogram of percent NG-positive cells after treatment with LPS (red line), untreated or control cells (green line) and isotype-matched controls for the TLR4 staining (dotted black line). Data represent relative percentage of (b) NG-positive cells compared to control cells, expressed as mean ± SD for several β-cell cultures derived from different pancreas donors (n = 7), and analyzed in triplicate. (c) Insulin mRNA expression is shown as mean ± SD (3 independent experiments) of relative fold increase compared to control (untreated) cells. (d) Insulin secretion measured by chemiluminescence in β-cell cultures isolated from two different pancreata expressed as relative percentage of insulin secretion observed in control cells, and analyzed in triplicate (mean ± SD). Statistically significant differences are indicated as (**) p < 0.005, as compared to non-treated control cells.