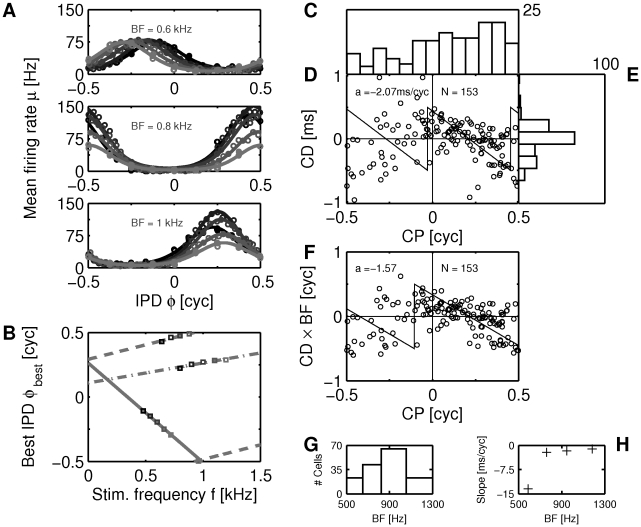
Figure 1. Frequency-dependence of ITD sensitivity.
(A) Tone delay functions for three exemplary DNLL neurons using five stimulus frequencies (dark to light grey indicates low to high frequency) centered at BF. Circles depict the means of measurements, the solid lines show a cyclic Gaussian fit (see Materials and Methods). (B) Best IPD vs. stimulus frequency (phase-frequency curves) for the three neurons from A (corresponding to the three different line styles). Note that the phase axis is cyclic. (C) Distribution of characteristic phases (CPs) for 153 DNLL neurons. (D) CPs and characteristic delays (CDs) exhibit circular-linear correlation. Best circular-linear fit is depicted by the solid line ( : slope). (E) Distribution of CDs. (F) Correlation between CP and
  . (G) Histogram of BFs. (H) Average slopes
  of the CP,
  distribution in the four frequency bands from G.

