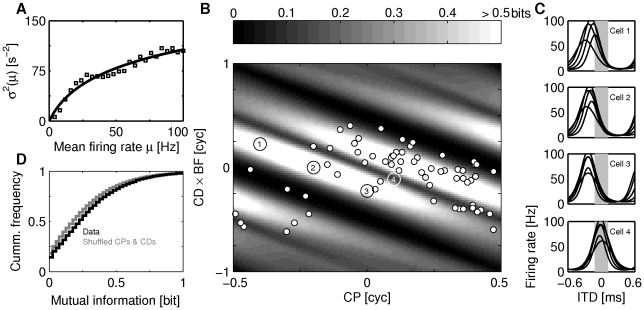
Figure 2. Rate statistics and mutual information.
(A) Variance  of the rate distributions as a function of mean firing rate
  (squares averaged over all 153 neurons) and a logarithmic fit (solid line). For low rates the slope of the variance is consistent with a Poisson process (see Materials and Methods). (B) Mutual information (MI; grey levels) as a function of CP and
  for average fit parameters of the tone delay function in the best frequency band between
  and
and  . Circles illustrate the distribution obtained from the DNLL population in this best frequency band. (C) Firing rate as a function of ITD for four exemplary combinations of CP and CD (large circles with numbers in B). Grey bars indicate the physiological range of ITDs. (D) Cumulative distributions of mutual information of the real CP-
 pairs (black) and for 1000 repetitive shuffles of CP and
  (grey).

