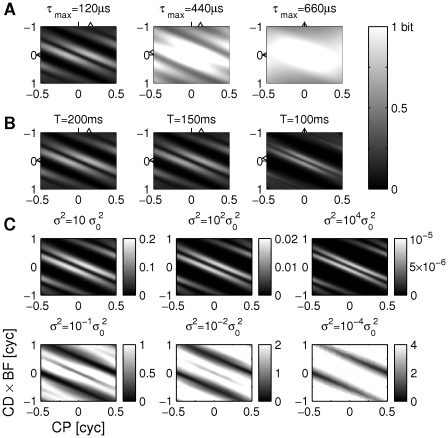
Figure 3. Parameter dependence of mutual information (MI).
(A) MI as a function of CP and  for three different inter ear distances and the respective physiological ranges
  . The left plot is a copy of Figure 2D. Axis are the same for all subplots (see bottom left of C). The triangles on the top indicate the CP of maximum mutual information, the ticks on the top indicate CP = 0. Triangles and ticks at the vertical axis indicate the analogous CD values. (B) MI for three different stimulus lengths. Again, the left plot corresponds to the default case from Figure 2D. Triangles follow the same convention as in A. The best phases (BP) are
  (
( ),
),  (
( ), and
  (
( ). (C) MI for six different noise levels. Noise is defined as multiple of the variance
  of the default case from Figure 2D. Note that the MI is depicted with different grey scales (in bits).

