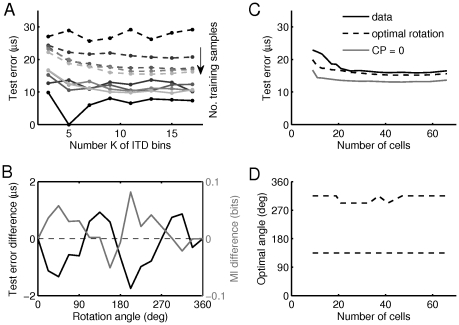
Figure 4. Linear separability of population patterns.
(A) Test error as a function of the number  of classifications bins for five different numbers of training samples (
 as indicated by grey level). Training errors are plotted as solid lines, test errors (localization acuity) are plotted as dashed lines. (B) Difference in test errors (black) and single-cell mutual information (grey) as a function of the rotation angle. Positive differences indicate that the value obtained with the non-rotated CP-CD distribution is larger. For the linear classifiers, the number of training samples was
  . (C) Test error as a function of the number of input neurons for the actually measured CP-CD distribution (solid line), for the optimal rotation angle (dashed line), and for CP set to zero (grey). (D) Optimal rotation angles at which the test error difference from B has local maximum.

