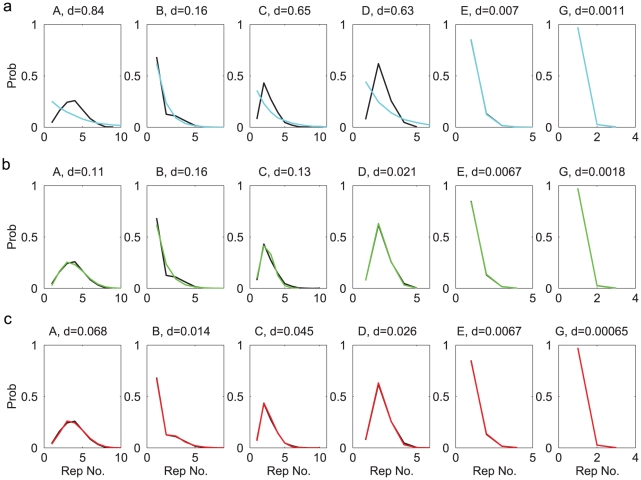
Figure 3. Comparisons of the repeat distributions for syllables A,B,C,D,E,G (Bird 1).
The black curve in each graph is from the observed syllable sequences. a. Comparison to the distributions from the Markov model (cyan curves). b. Comparison to the distributions from the Markov model with adaptation (green curves). c. Comparison to the distributions from the POMMA (red curves). The differences between the model and the observed curves are indicated with the  -values above each graph.

