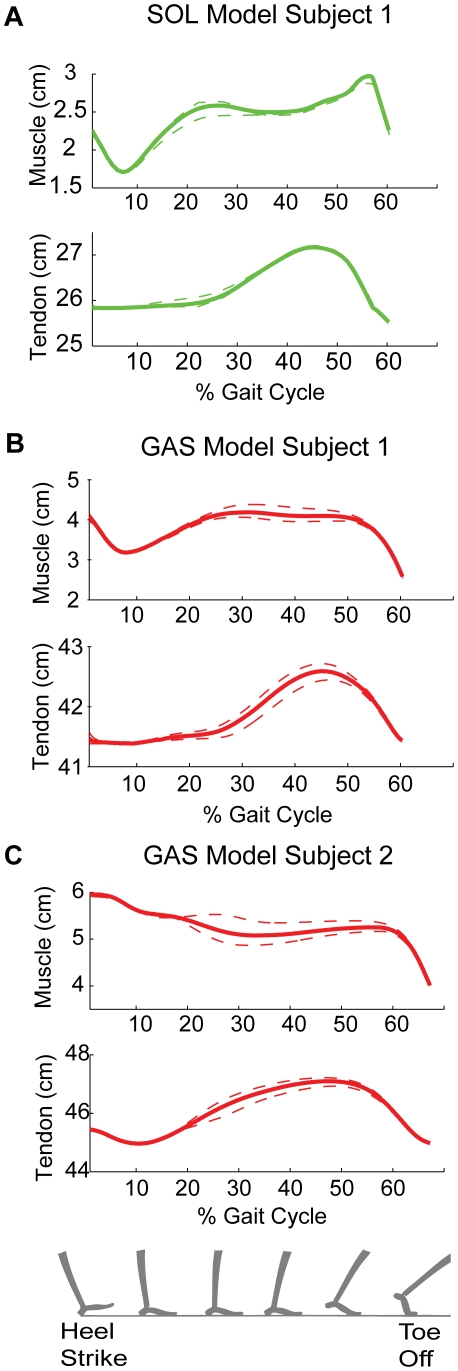
Figure 4. Model predictions of soleus and (medial) gastrocnemius muscle fascicle and tendon lengths.
Panel A displays soleus muscle and tendon length predictions, while Panels B and C display gastrocnemius muscle and tendon length predictions for two different subjects. Dashed lines in panels A, B and C represents standard deviations, propagated from standard deviations of data-based activation and muscle-tendon unit length estimates. Notable features across the panels include (a) the relatively small changes in muscle lengths for much of stance, (b) the slow stretch of tendons in mid-stance, and (c) the rapid recoil of tendons in late stance. These observations are qualitatively consistent with previously published ultrasonography-based measures on walking humans [5], [6]. Model muscle-tendon unit lengths (not shown) are directly related to the model muscle lengths and tendon lengths. Soleus and gastrocnemius actions have distinct features. Soleus fascicle strain profile has an eccentric phase between  % GC, while gastrocnemius fascicle length is largely isometric between
  % GC. The gastrocnemius fascicle strain profile is variable across subjects during the early stance and toe-off phases of the gait cycle.

