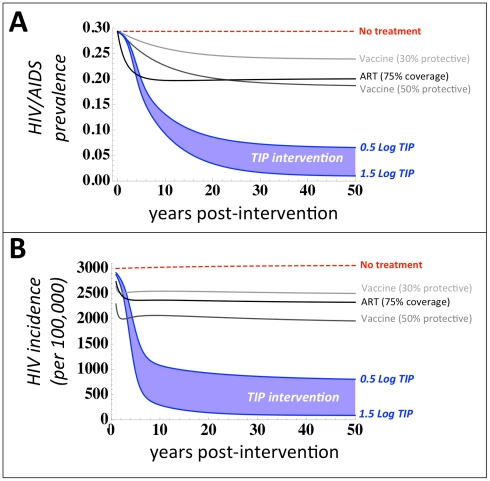
Figure 2. TIPs out-perform optimistic HIV vaccines and antiretroviral therapy (ART).
Projected impact of TIP intervention on (a) HIV/AIDS disease prevalence over 50 years (b) and HIV incidence per 100,000 individuals over 30 years, for two scenarios of TIP efficacy: a 0.5-Log viral-load reduction (upper blue line) and a 1.5-Log viral load reduction (lower blue line), based on a recent clinical trial [17], both initially deployed to 1% of individuals. TIP intervention is compared to a 30% protective vaccine (light grey), a 50% protective vaccine (dark grey), and ART (black). Vaccine scenarios are based on protection levels reported in a recent clinical trial [34] and UNAIDS target protection goals (50% protection) where each vaccine is assumed to have lifelong efficacy and optimistic levels of coverage (80% and 95% coverage of all risk groups, respectively). The ART scenario is assumed to treat 75% of all infections using a universal test-and-treat approach [27] where ART has 99% efficacy in halting HIV transmission.

