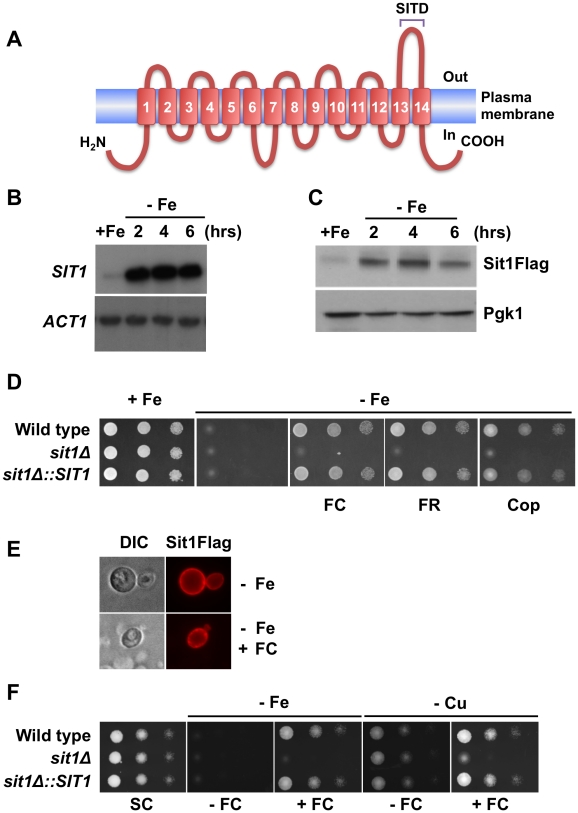
Figure 2. SIT1 substrate specificity and regulation under Fe deficiency.
A Schematic illustration of the predicted Sit1 topological features. Blast analyses of the carboxyl-terminal loop identified this conserved region as a SIderophore Transporter Domain (SITD). B RNA blot showing elevated steady-state levels of SIT1 mRNA under Fe deficiency at the time points indicated after chelation of extracellular Fe with BPS. C. Accumulation of Sit1Flag protein levels at the indicated time points following the addition of BPS. D Spot assays showing compromised growth of yeast strains under Fe limitation in the absence of substrate siderophores. All siderophores were used at a concentration of 10 µM and BPS was added at a concentration of 100 µM. E Sit1 is localized to the plasma membrane under Fe deficiency. Indirect immunofluorescence microscopy showing the accumulation of Sit1Flag at the plasma membrane under Fe deficiency in the presence or absence of ferrichrome (FC). Ferrichrome was added to Fe-deficient yeast cells 20–30 minutes prior to microscopic visualization F Siderophore utilization is functional under copper (Cu) deficiency. Spot assays were performed under either Fe limitation or Cu limitation in the presence or absence of ferrichrome as indicated.

