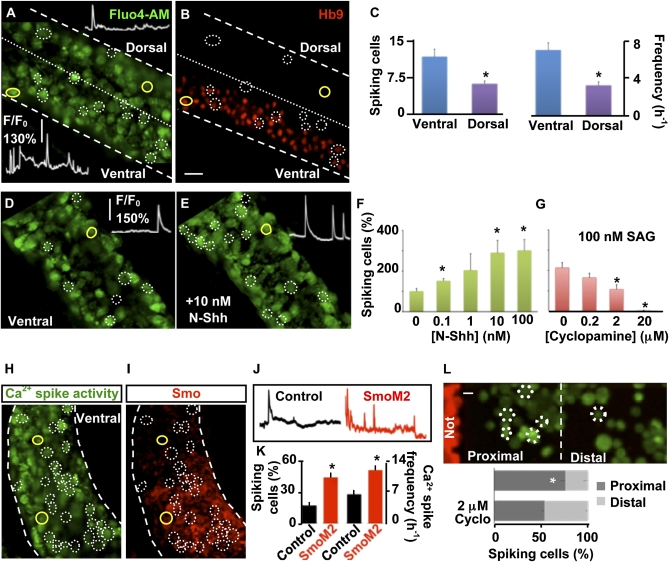
Fig. 2.
Shh increases Ca2+ spike activity of developing spinal neurons. (A) Lateral view of a developing spinal cord showing higher levels of Ca2+ spike activity in the ventral than in the dorsal neural tube (stage 24). (B) After imaging, the same preparation was whole-mount immunostained for homeodomain protein Hb9, a ventrally expressed neuronal marker, to indicate its dorsoventral orientation. Circles identify cells spiking during 20-min recording, and Insets in A show Ca2+ spike activity for cells outlined in yellow. (C) Incidence of spiking cells per neural tube and frequency of Ca2+ spikes in ventral and dorsal spinal neurons. (D and E) Ventral view of stage-24 developing spinal cord in the absence (D) or presence (E) of N-Shh. Insets show Ca2+ spike activity during 15-min recording from the same cell (outlined in yellow). (F) Dose–response curve for N-Shh–induced Ca2+ spike activity. Data are mean ± SEM percent of spiking cells in the presence of N-Shh compared to number of cells spiking before addition of N-Shh (0). (G) Dose–response curve for cyclopamine blockade of Ca2+ spike activity induced by SAG. Data are mean ± SEM percent of spiking cells in the presence of SAG and cyclopamine compared to number of cells spiking before addition of cyclopamine (0). (H–K) Expression of SmoM2 increases Ca2+ spike activity. (H) Electroporation of a stage-19 embryo with SmoM2 demonstrates a higher incidence of Ca2+ spike activity 6 h after electroporation (stage 24) in electroporated cells (red) than in nonelectroporated cells (black). (I) Effective overexpression of SmoM2 was verified by whole-mount immunostaining against Smo after Ca2+ imaging. Circles identify cells spiking during recording. (J) Ca2+ spike activity during 20-min recording for immunonegative and immunopositive cells outlined in yellow in H and I. (K) Bar graphs show mean ± SEM percent incidence of spiking cells and spike frequency for electroporated (SmoM2) and nonelectroporated (Control) cells. n = 5 stage-24 (26-h postfertilization) embryos per experimental group (C–K). (L) Endogenous Shh released by the notochord increases Ca2+ spike activity of neurons. (Upper) Dissociated neuron/notochord explant (Not) coculture. (Lower) The imaged field was divided in halves proximal and distal to the notochord explant. Values are mean ± SEM percent of spiking cells in proximal and distal regions in the absence or presence of cyclopamine (Cyclo). n = 5 independent cultures; *P < 0.05. (Scale bars, 20 μm.)

