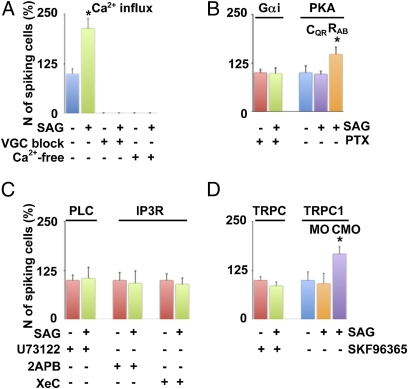
Fig. 3.
Molecular identification of the components linking Shh and Ca2+ spike activity. (A–D) Ca2+ imaging of the ventral spinal cord. (A) Ca2+ influx was blocked by a mixture of Na+ and Ca2+ voltage-gated channel blockers (VGC block) or by perfusion with a Ca2+-free medium (Ca2+-free). (B) Gαi was inhibited by 10 mM PTX. Perturbations of PKA activity were implemented by electroporating constitutively active (CQR) or dominant negative (RAB) forms of PKA in stage-19 embryos. Ca2+ imaging was performed 6 h after electroporation. (C) PLC was inhibited by 10 μM U73122, and IP3R were inhibited by 20 μM 2-aminoethoxydiphenyl borate (2-APB) or 20 μM xestospongin C (XeC). (D) TRPC channels were blocked by 50 μM SKF96365 or by molecular knockdown with xTRPC1 morpholino (MO). Control morpholino (CMO). Values are mean ± SEM percent incidence of spiking cells in the ventral surface of neural tubes compared with control (30-min recording before addition of 100 nM SAG). n = 5 stage-24 (26-h postfertilization) embryos per experimental group; *P < 0.05 (A–D).

