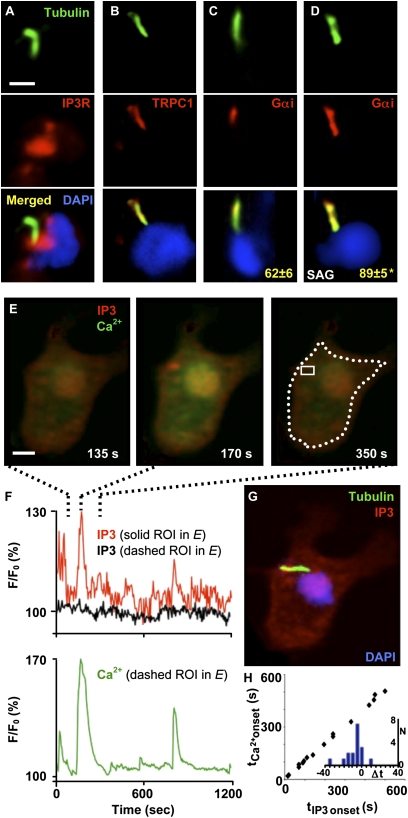
Fig. 4.
Shh and second-messenger signaling converge at the neuronal primary cilium. (A–D) Immunostaining of immature spinal neurons grown in vitro for 7 h. Acetylated tubulin staining is shown in green, and DAPI staining is shown in blue. (A) IP3R (red) localize at the base of the primary cilium. (B) TRPC1 (red) localizes to the primary cilium. (C and D) Gαi protein (red) localization at the primary cilium expands when Shh signaling is enhanced. Numbers correspond to the mean ± SEM percent of acetylated tubulin labeling that overlaps with Gαi staining at the primary cilium in the absence (C) or presence (D) of 100 nM SAG for 4 h. n = 10 cells per condition; *P < 0.005. (E and F) Simultaneous Ca2+ and IP3 imaging reveals synchronous transients. (E) Images correspond to a time before (Left), during (Center), and after (Right) the spike indicated in the trace in F. (F) Traces represent the changes in fluorescence intensity for IP3 and Ca2+ probes in regions of interest (ROI) indicated in E, Right. (G) IP3 transients are apparent at the primary cilium. The cell is the same shown in E, stained with DAPI (blue) and anti-acetylated tubulin (green) and overlapped with IP3 frame (red) corresponding to the peak of the transient shown in E, Center. (Scale bars, 10 μm.) (H) Synchronicity of Ca2+ and IP3 transients. Graph represents onset time of Ca2+ spikes vs. onset time of IP3 transients during simultaneous recordings. Inset represents the histogram of the difference between onset times; Δt = tIP3 − tCa2+.

