Fig. 3.
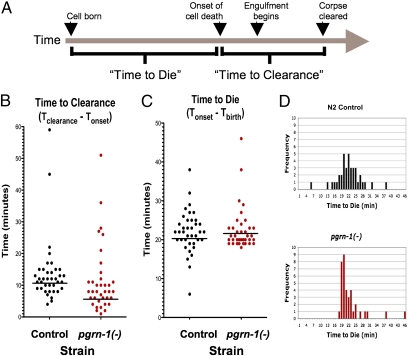
Loss of progranulin accelerates the clearance of apoptotic cells in C. elegans. With the use of four-dimensional Nomarski time-lapse video microscopy, the time to clearance and time to die were determined for early deaths in the AB lineage in control animals and pgrn-1(tm985) mutants (n = 3 embryos per strain). (A) Diagram depicting approximate relative timing of events in time to die and time to clearance. (B) Results for time to clearance are shown in a scatterplot in which each circle represents a single cell-death observation. Harmonic means were 10.7 min for control and 5.7 min for pgrn-1–mutant animals (Mann–Whitney t test, P = 0.0036). (C) Results for time to die are depicted in a scatterplot in which each circle represents a single cell-death observation. Mean times to die were 20.2 min for control animals and 21.7 min for pgrn-1 mutants (harmonic means, Mann–Whitney t test, P = 0.3). (D) Frequency distribution histogram for time to die. The distribution of deaths in control animals was Gaussian, whereas in pgrn-1 mutants it was not (D'Agostino–Pearson omnibus normality test, P = 0.05 and P < 0.0001, respectively).

