Fig. 1.
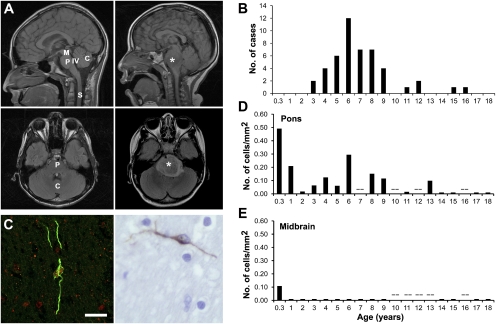
Spatiotemporal distribution of ventral pontine PPCs and incidence of DIPG. (A) Sagittal and axial MRI scans showing normal brainstem anatomy (Left) and DIPG (Right). The DIPG tumor is indicated by an asterisk. C, cerebellum; M, midbrain, P, pons, S, spinal cord; IV, fourth ventricle. (B) Incidence of DIPG expressed at age of diagnosis. Data were drawn from the Stanford University Brain Tumor Database and represent all patients with DIPG cared for at Stanford University Medical Center from 1997–2008 (n = 47). (C) Ventral PPC visualized on confocal micrograph [Left; Nestin (green) and Olig2 (red), magnification 40×] and light micrograph [Right; Nestin (brown), magnification 60×]. (Scale bar: 50 μm.) Density of Nestin+ cells in the human ventral pons (D) and midbrain (E) as a function of postnatal age (n = 24). Each data point represents one to two cases; when two cases are represented, the value expressed is an average of the two. The symbol (--) denotes an age at which no valid tissue samples were available for analysis. Comparable data in the medulla are presented in Fig. S1E.

