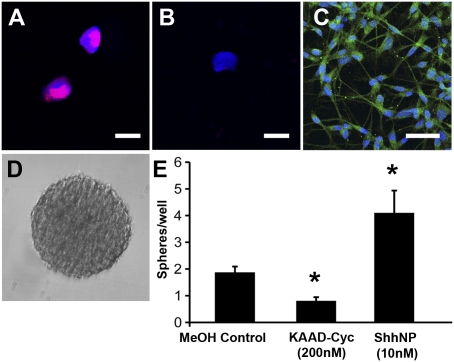
Fig. 5.
Hh pathway activity in DIPG. (A) DIPG tumor cells transduced with a lentiviral Hh pathway reporter construct, Gli1::RFP. A confocal photomicrograph (magnification 40×) illustrates RFP (red) and a DAPI nuclear counterstain (blue). (B) Confocal photomicrograph (magnification 40×) illustrates lack of RFP (red) signal in negative control tumor cells transduced with a mutated Gli1 binding site::RFP construct and a DAPI nuclear counterstain (blue). (Scale bar: 30 μm.) (C) Confocal photomicrograph (magnification 40×) demonstrates Shh ligand expression (green) in DIPG tumor neurosphere cells. A DAPI nuclear counterstain (blue) is also shown. (D) Light micrograph (magnification 10×) of a secondary tumor neurosphere at 14 d following dissociation and FACS sorting of live cells at low density (100 cells per well in a 96-well plate format). (E) Quantification of secondary tumor neurospheres (such as that seen in D) at 14 d following dissociation and FACS sorting of live cells at low density (100 cells per well) and exposed to either KAAD-cyclopamine (200 nM), ShhNp (10 nM), or methanol vehicle control. Data are expressed as the average number of tumor neurospheres per well ± SEM (n = 10–16 wells per condition; *P < 0.05).

