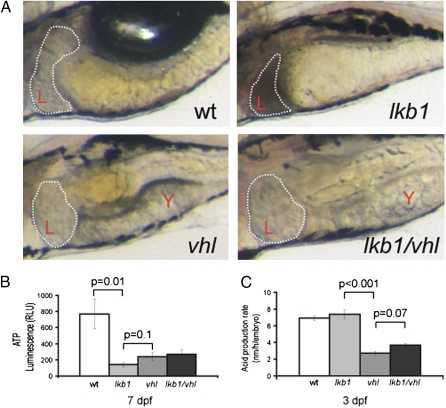
Fig. 6.
Loss of vhl suppresses manifestation of the lkb1 phenotype. (A) High-power images depicting the liver and intestine of live larvae of the indicated genotypes at 7 dpf; anterior is to the left. Note that some yolk (Y) is still present. The intestine is folded, and the liver is clear in the lkb1/vhl larva. (B) Graph showing ATP levels as measured in relative light units (RLU). The lkb1 embryos have very low ATP levels; ATP levels are decreased in vhl and lkb1/vhl embryos but are slightly higher than in lkb1-mutant embryos. (C) Graph representing the metabolic rate of larvae of different genotypes at 3 dpf. The lkb1-mutant larvae have an increased metabolic rate as compared with WT larvae. The vhl larvae display a dramatically low metabolic rate, and the lkb1/vhl larvae also display a low metabolic rate.

