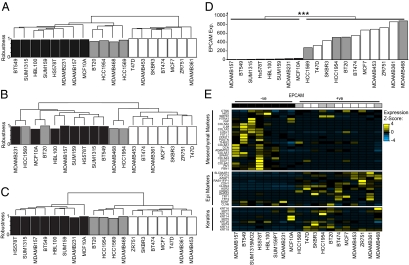
Fig. 3.
SRAM gene expression segregates breast cancer cell lines into cells of epithelial and mesenchymal lineage. (A–C) Dendrograms derived from unsupervised hierarchical clustering of the cell lines based on expression of the 1,000 most variably expressed genes (A), percentage methylation of the 1,023 VM genes (B), and expression values from a subset of genes that are SRAM (120 genes; C). The robustness of each sample's cluster membership is shown below the dendrogram, expressed as the percentage of permutations in which that sample grouped in its cluster (consensus clustering, see supplementary methods). White, luminal A; gray, basal A; black, basal B (according to ref. 11). (D) The expression of EPCAM correlates with the two main clusters derived in C (P < 2.2 × 10⁻¹⁶, Wilcoxon test). The cell lines are ordered based upon their expression of EPCAM. Color coding as for A–C. (E) Markers of epithelial and mesenchymal lineages (SI Materials and Methods) are differentially expressed between the cell lines. The cell lines are ordered and color-coded as in D. Genes that were silent in all 19 cell lines were excluded from the analysis.

