Fig. 5.
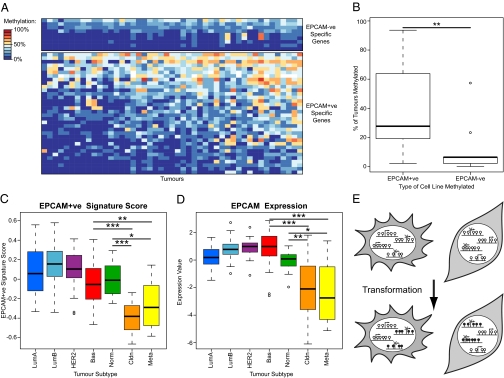
Lineage-specific aberrant methylation occurs in primary breast tumors. (A) Heat map indicating methylation frequency of differentially methylated SRAM genes in 47 primary breast tumors. Only genes that are unmethylated in the normal breast are shown. Genes and samples are ordered by their frequency of methylation. A larger version of the heat map is in Fig. S5A. (B) Genes methylated in EPCAM+ve cell lines are more frequently methylated in primary tumors. The frequency of methylation in tumors of the groups of genes shown in A was compared. Significance was assessed using a Wilcoxon test. (C) Boxplot of EPCAM+ve SRAM expression signature scores by tumor type for a series of breast tumors. Claudin-low (Cldn) and metaplastic tumors (Meta) have scores that are significantly lower than all other subtypes (Wilcoxon tests). A plot using an EPCAM−ve signature is in Fig. S5E. (D) Boxplot of EPCAM expression by tumor subtype. Claudin-low and metaplastic tumors have significantly lower EPCAM expression than the other subtypes (Wilcoxon tests). (E) Model showing that normal lineage commitment leads to the repression of genes in a lineage-specific manner. Lineage-repressed genes are prone to hypermethylation upon transformation. *P < 0.05; **P < 0.01; ***P < 0.001, Wilcoxon tests.

