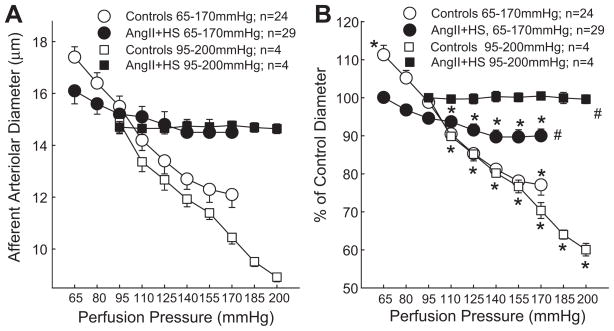
Figure 1.
Afferent arteriolar response to increasing renal perfusion pressure in kidneys of normotensive (Open Symbols) and AngII+HS (Closed Symbols) rats. Autoregulatory profiles ranging from 65 to 170mmHg are depicted by circular symbols whereas profiles generated from 95 to 200mmHg are depicted by square symbols. Panel A represents the actual diameter responses expressed in microns (μm). Panel B expresses the same data normalized as a percent of the starting diameter for each group (% of control). Data points represent the means±SE. * represents a significant difference (P<0.05) from the baseline diameter at 100 mmHg; # represents a significant difference (P<0.05) from the response of normotensive controls; n = the number of afferent arterioles studied.

