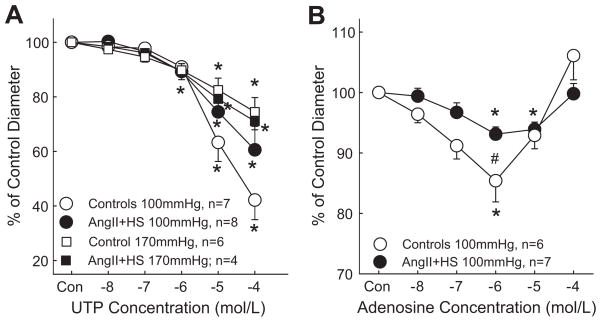
Figure 3.
Afferent arteriolar response to increasing concentrations of UTP (Panel A) or adenosine (Panel B). Results from kidneys perfused at 100mmHg are depicted by circular symbols whereas data from kidneys perfused at 170mmHg are depicted by square symbols. Agonists were applied in the superfusate in successive log increases in concentration from 10−8 to 10−4 mol/L. Data points represent the means ± SE. * represents a significant difference (P<0.05) from the starting diameter; # represents a significant difference (P<0.05) from normotensive controls; n = the number of afferent arterioles studied.

