
Figure 2.
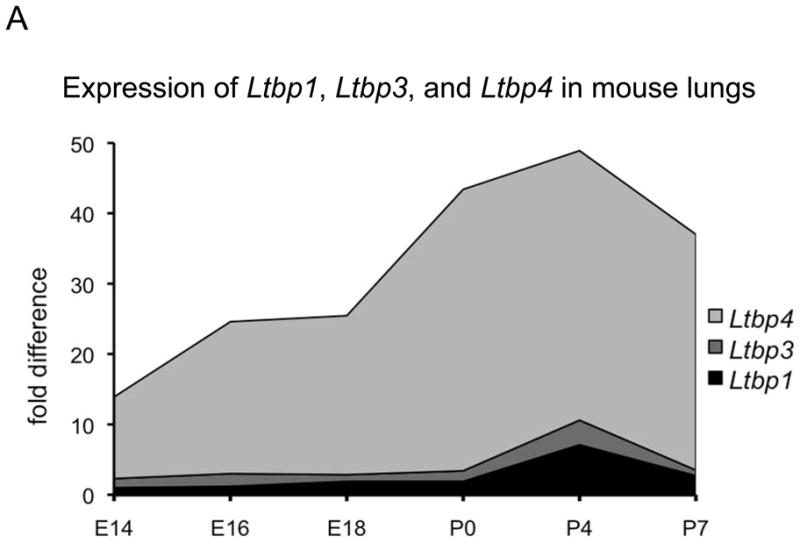

Ltbp1, Ltbp3 and Ltbp4 expression in WT mouse lungs. A. Relative expression levels of Ltbp1, Ltbp3 and Ltbp4 was assessed by Q-RT-PCR using total RNA extracted from mouse lungs as templates; 3–4 lungs were used per genotype. All samples are standardized to HPRT. Ltbp4 expression levels are 30–40 times higher than the expression levels of Ltbp3 and Ltbp1. The expression level of Ltbp3 peaks at P4 and by P7 decreases to the low levels detected during embryonic development. Ltbp4 expression is also highest at P4, but it also remains high at P7. Expression levels of Ltbp1 are very low in embryonic lungs and somewhat increased after birth at P4. However expression of Ltbp1 is lower than expression of Ltbp3 and Ltbp4 at all time points. B. ISH expression pattern of Ltbp3 and Ltbp4 in lung tissue. In embryonic lungs at E16.5 both Ltbp3 and Ltbp4 are expressed in terminal bronchioli, as indicated by arrows. P7 Ltbp4 transcripts were detected throughout the lung tissue. The expression was not uniform, and some lung cells gave stronger ISH signal (arrows). At P7 Ltbp3 transcripts were confined to a small number of lung cells (arrows). Bars: 20 μm.