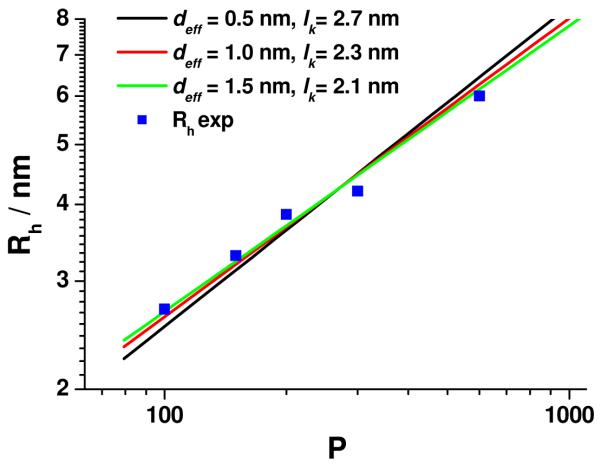
Figure 3.
Double logarithmic plot of the hydrodynamic radius Rh vs. the number of peptide repeat units P. The lines represent the best fits to the data assuming a repeat unit length b = 0.365 nm. Black line: deff = 0.5 nm, lk = 2.7 nm, red line: deff = 1.0 nm, lk = 2.3 nm, green line: deff = 1.5 nm, lk = 2.1 nm.

