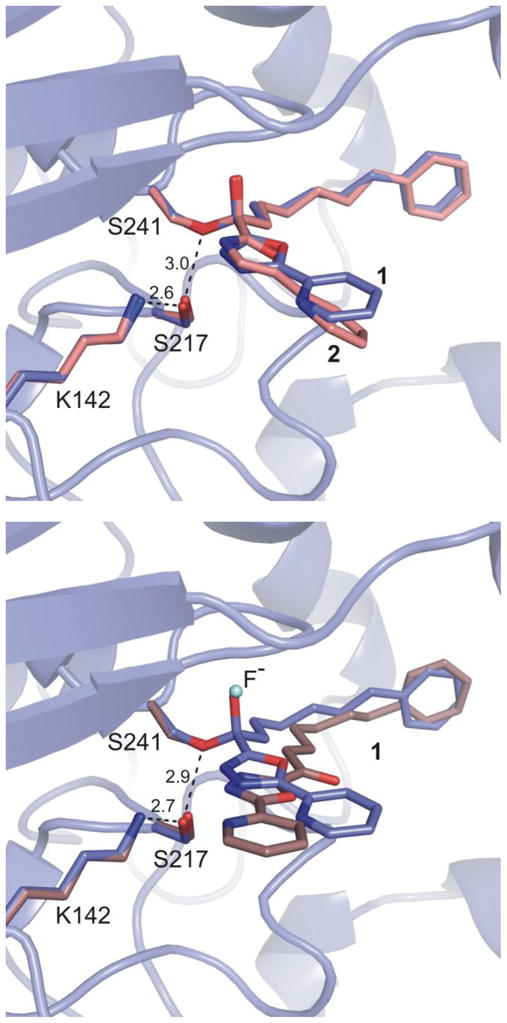
Figure 2.

Top: Overlay of inhibitor 1 in the two bound states. Bottom: Overlay of covalently bound 1 and 2 (OL-135). Covalently bound inhibitor 1 is shown in light blue, noncovalently bound inhibitor 1 in brown, and 2 in pink. Interatomic distances of the noncovalent structure (top) and covalent structure (bottom) are shown with dashes and measured in Å.
