Figure 4.
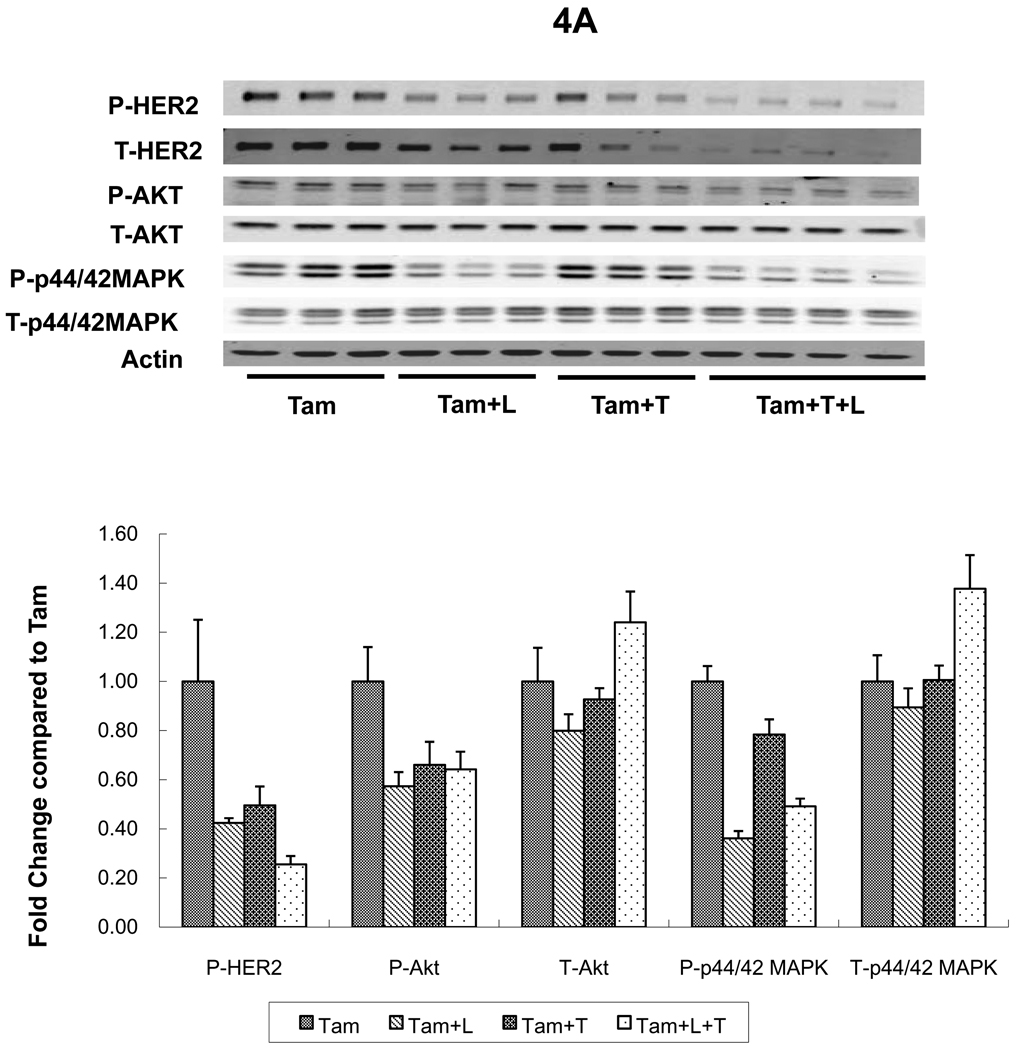
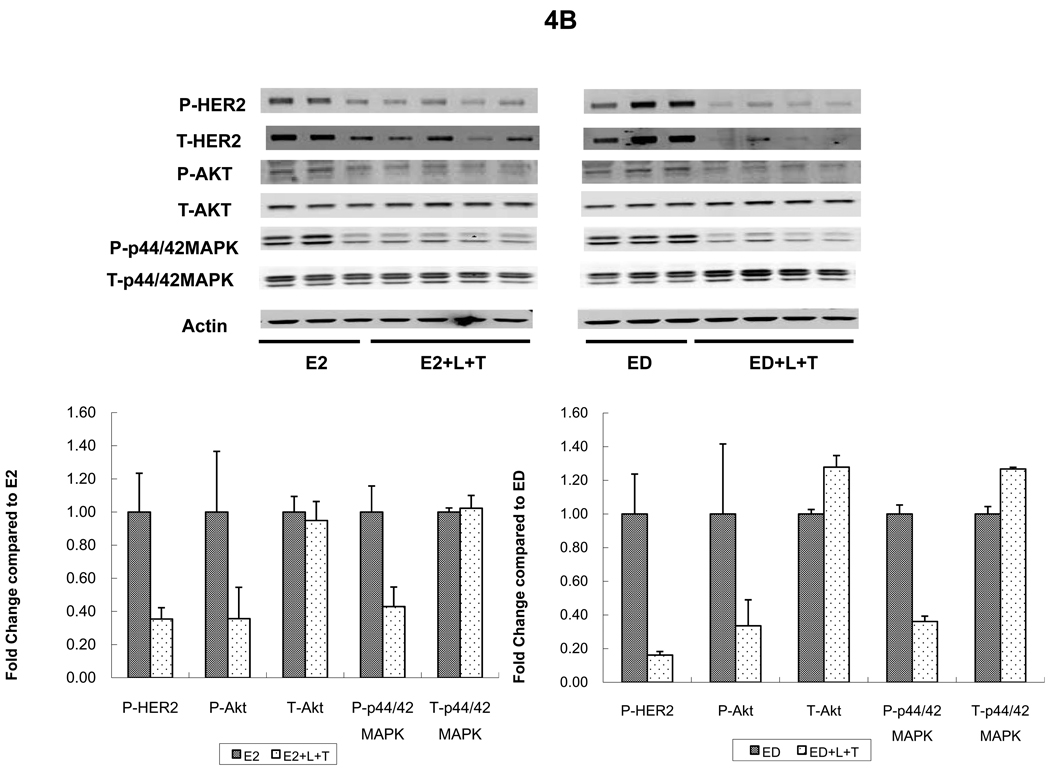
HER2 and downstream signaling pathways were assessed in tumors from two cell lines grown as xenografts in athymic mice and treated for 3 days. A. MCF7/HER2-18 xenograft tumors treated with tamoxifen (Tam) alone or with lapatinib (Tam+L), trastuzumab (Tam+T), or their combination (Tam+L+T). B. MCF7/HER2-18 xenograft tumors grown with estrogen (E2) alone or with the combination of lapatinib and trastuzumab (E2+L+T) and estrogen deprivation (ED) alone or with the combination of lapatinib and trastuzumab (ED+L+T).
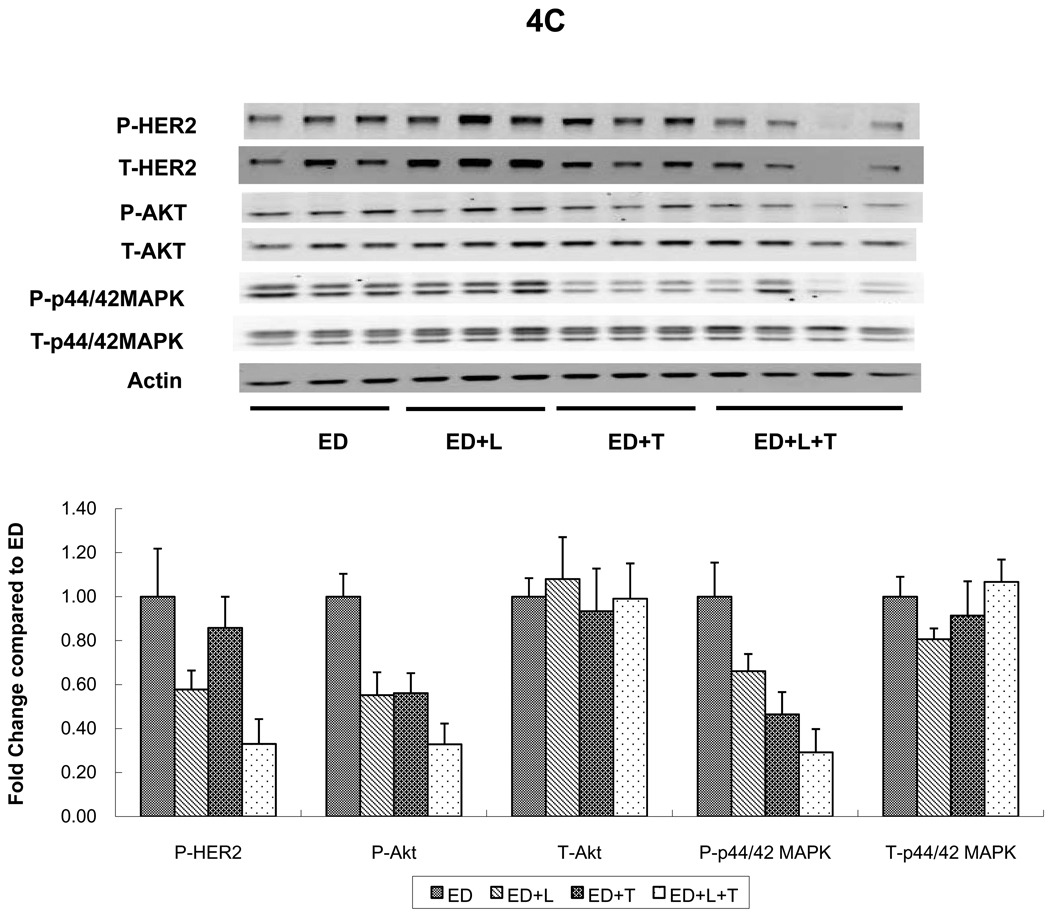
C. BT474 xenograft tumors treated with estrogen deprivation (ED) alone or with lapatinib (ED+L), trastuzumab (ED+T), or their combination (ED+L+T). Proteins from tumor lysates were separated by sodium dodecylsulfate-polyacrylamide gel electrophoresis and subjected to immunoblot analysis with antibodies specific to total HER2, total Akt, total MAPK, phosphorylated HER2 (at Tyr1248); phosphorylated Akt (at Thr308) and phosphorylated p44/42 MAPK (at Thr202 and Tyr204); or β-actin. Protein expression and phosphorylation levels were quantified by Odyssey Infrared Imaging System. In each tumor, protein levels were normalized to the level of β-actin (the loading-control; by the formula, protein level/actin level *100). For each treatment arm, protein expression levels were compared with control group (Tam, E2, ED) as 1.00.
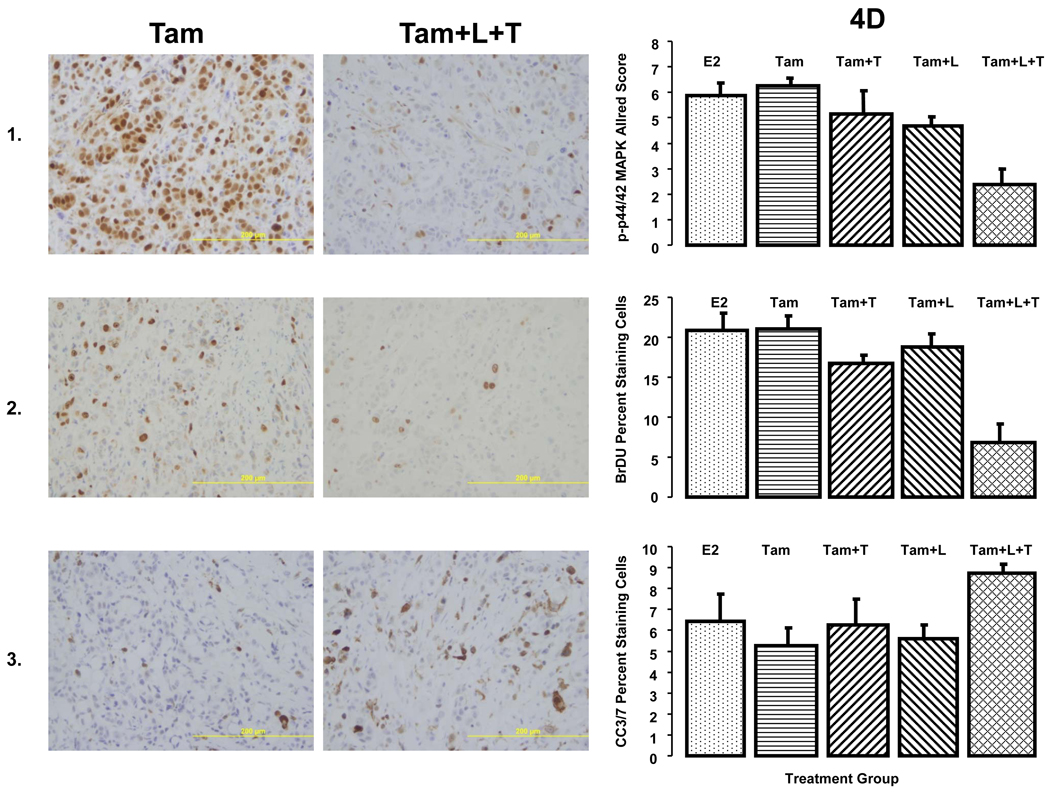
D. IHC studies on MCF7/HER2-18 xenografts: The pictures on the left are representative images of each biomarker staining. The panels on the left are quantitative representations of biomarker expression.
Panel 1. Expression of phosphorylated p44/42 MAPK (at Thr202 and Tyr204) in MCF7/HER2-18 xenograft tumors treated with estrogen (E2), tamoxifen (Tam) alone, or with lapatinib (Tam+L), trastuzumab (Tam+T), and the combination (Tam+L+T). The length of treatment was 3 days. Levels of phosphorylated MAPK were assessed by immunohistochemical staining and reported using the Allred Score. There were at least 8 tumors from each group. Panel 2. Cell proliferation: Bromodeoxyuridine staining was used to measure cell proliferation. Proliferation was measured in tumors, eight from each treatment group, after 3 days of treatment. Results are the percentage of cells positive for bromodeoxyuridine. Panel 3. Apoptosis Levels of cleaved caspase 3/7 were assessed immunohistochemically by use of an antibody against cleaved caspase 3/7 after day 3 of treatment. Apoptosis was measured at least 8 tumors from each treatment group. Results are the percentage of cells positive for cleaved caspase 3/7.
In all panels, error bars represent the standard error.


