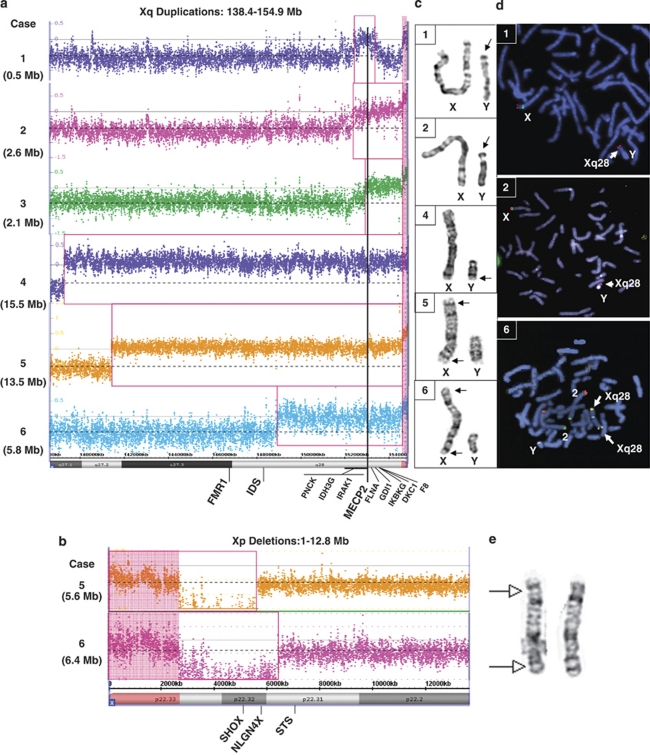
Figure 2.
Cytogenetic and molecular cytogenetics analyses. Array plots for the distal Xq region (a) and distal Xp region (b) are shown for each case. The bottom horizontal bar indicates coordinates in Mb. Red boxes indicate probes that detected a gain or loss in copy number for each patient. Vertical black line indicates location of the MECP2 gene. A log2 ratio of zero indicates a copy number (CN) of two for males. In the chromosome analysis suite software, the PAR regions of X are CN=2 in normal males (probes on the X and Y contribute to the signal), whereas the rest of the X chromosome is CN=1. Copy number changes involving the PAR regions display a shift in the log2 ratio (pink highlighted regions). In case 4, the shift on Xq PAR is not observed, suggesting that the PAR on Yq was lost in the t(Xq;Yq) translocation. (c) GTG-banded chromosomes X and Y for cases 1, 2, 4, 5 and 6. (d) FISH analyses for cases 1 and 2 show an Xq28 probe in red (RP11-119A22 in case 1, RP11-143H17 in case 2) hybridizing to Yp. FISH analysis for case 6 shows an Xq28 probe (yellow) hybridizing to both distal Xq and distal Xp. (e) GTG-banded X chromosomes from the mother of patient 5. Arrows indicate the approximate breakpoints of the pericentric inversion.

