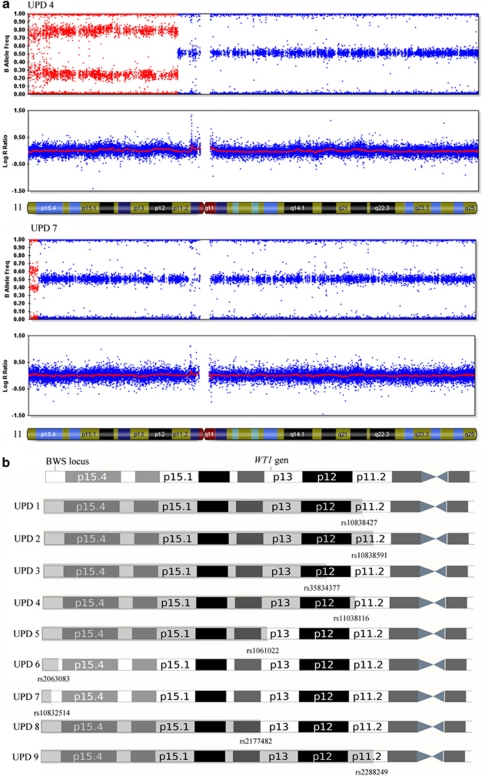
Figure 2.
(a) SNP-array results for two UPD patients (UPD 4 and UPD 7). The B allele frequency is shown in the upper panel of each patient. The red zone represents the chromosome fragment with UPD and the level of mosaicism for each SNP. The graph log R ratio is the measure of genomic dosage (normal in both patients). Note the differences presented by these two cases on the extent of UPD fragment and their level of mosaicism, which is higher for patient UPD 4 than UPD 7. (b) Graphic representation of the UPD extension for each patients and the latest SNP involved in the breakpoint. The color reproduction of this figure is available on the html full text version of the manuscript.

