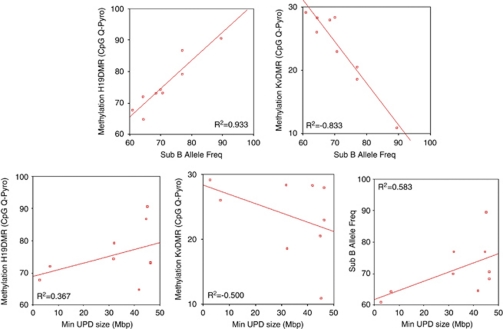
Figure 3.
Scatter graph of Spearman's correlations and relatives R2 values. (a) These two graphs represent the direct and inverse correlation between the percentage of mosaicism and the methylation level at H19DMR and KvDMR loci, respectively. (b) Graphic representation showing that there is no correlation between the size of the UPD fragment and the methylation level of both ICs and the percentage of mosaicism.

