
Figure 2. Comparison of visual responsiveness.
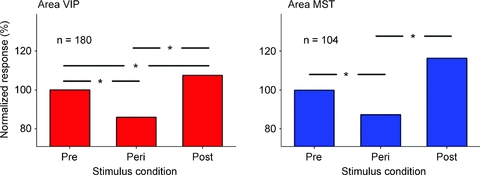
In areas MST and VIP, the median visual response during fixation long before a saccade was normalized to a value of 100%. The response was computed for a pre-selected response window (75–125 ms after stimulus onset). Responses in motion-sensitive areas MST and VIP were statistically different in the three stimulus periods (P < 0.001, repeated measures ANOVA on ranks). A pair-wise multiple comparison (Tukey test) revealed that the Peri-responses were significantly smaller than the responses in the Pre- and the Post-condition. In addition, in area VIP, the responses in the Post-condition were significantly stronger than in the Pre-condition (P < 0.05, Tukey test).