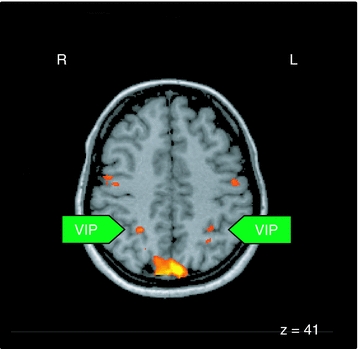
Figure 4. Activation pattern related to OKN relative to baseline as a result of the group analysis.

All areas were significant at P < 0.05 corrected. R, right hemisphere; L, left hemisphere; The z-value indicates the coordinate of the horizontal image, VIP, ventral intraparietal area.
