
Figure 1. Calculation of Fisher information and discrimination thresholds for an example neuron.
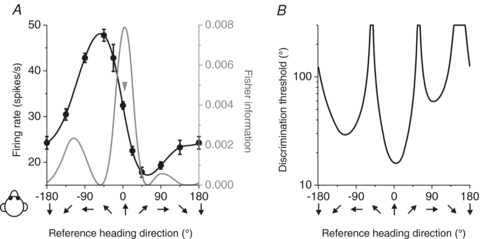
A, example tuning curve (black) and Fisher information (grey). Arrow indicates the direction corresponding to peak Fisher information. B, neuronal discrimination thresholds (computed from Fisher information) as a function of the reference heading.