
Figure 2. MSTd population responses.
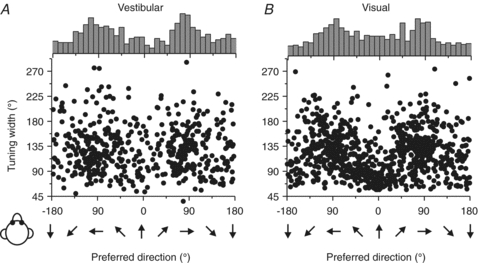
Scatter plots of each cell's tuning width in the vestibular (A; n= 511) and the visual (B; n= 882) conditions plotted versus preferred direction. The top histogram illustrates the marginal distribution of heading preferences. Replotted with permission from Gu et al. (2010).