
Figure 4. Comparison of predicted and measured heading thresholds as a function of reference direction.
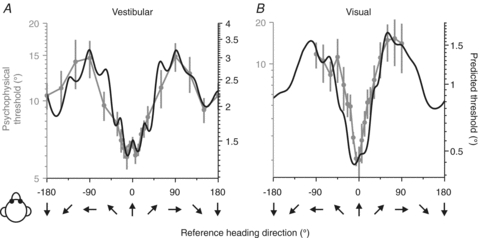
Human behavioural thresholds (grey symbols with error bars) are compared with predicted thresholds (black) computed from neuronal responses in the vestibular (A; n= 248) and the visual (B; n= 472) conditions. Note that the ordinate scale for predicted and behavioural thresholds has been adjusted such that the minimum/maximum values align. This is because it is the shape of the dependence on reference heading that we want to compare; we cannot simply interpret the absolute values of predicted thresholds, as they depend on the correlated noise among neurons and the number of neurons that contribute to the decision, which remains unknown. Replotted with permission from Gu et al. (2010).