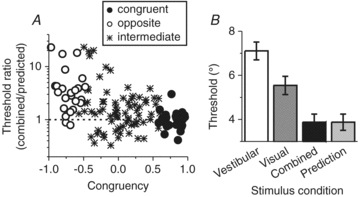
Figure 7. Cue combination: MSTd population summary.

A, neuronal sensitivity under cue combination depends on congruency of visual and vestibular tuning. The ordinate in this scatter plot represents the ratio of the neuronal threshold measured in the combined condition to predicted threshold from optimal cue integration. The abscissa represents the Congruency Index of heading tuning for visual and vestibular responses, which quantifies the degree to which neuronal tuning is similar in the visual and vestibular conditions. Dashed horizontal line: threshold in the combined condition is equal to the prediction. B, comparison of the average neurometric threshold, computed from congruent cells only (with congruency index >0), in the combined condition (black bars) relative to the single cue thresholds (vestibular: open bars; visual: dark grey bars) and compared to predicted thresholds based on statistically optimal cue integration (light grey bar). Replotted with permission from Gu et al. (2008).
