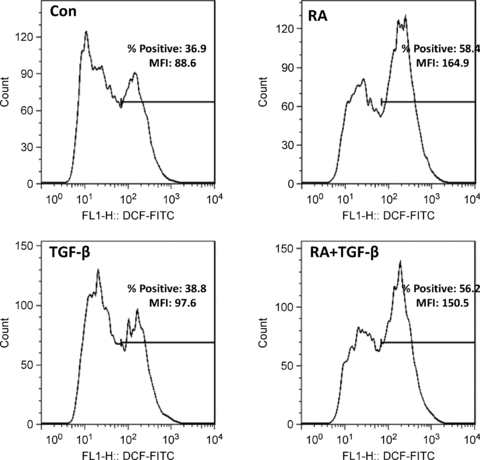
Figure 6. Induction of ROS assessed by flow cytometry using a lower RA concentration for a longer treatment time.

HESC were incubated for 6 h in RA (1 μm), TGF-β (5 ng ml−1), RA + TGF-β, or vehicle control (Con) as indicated and analysed for fluorescence in DCF-loaded cells by flow cytometry as described in Methods. Results are expressed as mean fluorescence intensity (MFI) and percentage positive cells relative to an isotype control antibody.
