
Figure 7. Activation of locus coeruleus and A5 neurons by metabolic acidosis in slices.
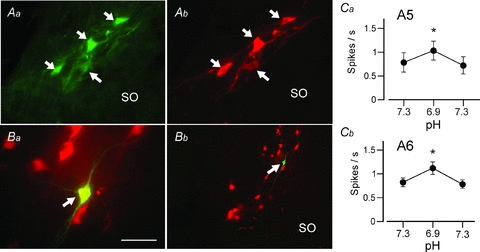
A, selective expression of GFP by TH-ir neurons in the A5 region of the TH-GFP transgenic mouse used in all experiments (Aa, GFP immunoreactivity; Ab, TH immunoreactivity). B, example of one A5 neuron recorded in a slice and labelled with biotinamide (Ba, recorded, biotinamide-labelled neuron immunoreactive for TH surrounded by other A5 neurons; Bb, low magnification photograph showing the recorded neuron within the cluster of A5 neurons). Scale bar represents 50 μm in Aa, Ab and Ba, and 200 μm in Bb. Ca, small, reversible and statistically significant increase in the firing rate of A5 neurons exposed to metabolic acidosis in slices (isotonic reduction of bicarbonate at constant CO2). Cb, identical experiment on locus coeruleus noradrenergic neurons.